| The Conspiracy
A Little Study of Egyptian/Masonic Star Alignments in the Skies Over Cape Canaveral at the Times of Space Shuttle Launches Since 1996 Richard Hoagland has been claiming on the Enterprise Mission (TEM) web-site that the policies of NASA concerning extraterrestrial life and the existence of possible artificial structures on Mars and elsewhere in the Solar System have been greatly influenced by powerful Masonic groups, (click "stargate" for details µµµ). More specifically TEM has asserted that it is NASA personnel with an affiliation to the Scottish Rite 33 degree Freemasons who have been pulling the strings behind the scenes. During the history of the United States many leading Freemasons such as George Washington and the 33rd vice-president, Henry Wallace, have viewed the young nation as a great Masonic project to enlighten the World. TEM see the esoteric influence over NASA as another mysterious Masonic project in the same vein. A major plank of TEM's evidence for the mysterious Masonic influence over NASA has been their claim that since the start of the American space programme an internal group has been attempting to synchronise mission schedules to co-incide with a system of star alignments based on Egyptian/Masonic symbolism. Unlike their other evidence of Masonic influence this claim can be tested objectively and statistically. It is almost common knowledge that part of the tradition of the higher degrees of Freemasonry is the practice of electional astrology - that is to say setting the times and dates of important events for when the astrological situation is auspicious, (click "stargate" µµµ). In his book The Secret Zodiacs of Washington DC David Ovason shows how the public Masonic corner stone laying rituals involving the first governmental buildings in Washington DC co-incided with auspicious astrological line ups (click "stargate" µµµ). Ovason goes on to theorise that Washington DC was symbolically dedicated by George Washington and his fellow Freemasons to the zodiacal constellation Virgo, which is astrologically linked with the Virgin Mary and (more importantly) the Egyptian goddess Isis. David Ovason's book has a glowing preface written by C. Fred Kleinknecht, the Sovereign Grand Commander of American Freemasonry. So whether or not Ovason's theory is true, the higher echelons of today's less public style of Freemasonry see Ovason's theory as being within their traditions. (Interestingly the Kleinknecht family have had important professional involvement with NASA, µµµ).
|
| C Hoagland & Bara's Egyptian/Masonic Star Alignment Model According to the theory of Richard Hoagland and Mike Bara the shadowy behind the scenes group they theorise about do not use a conventional form of astrology. Instead they target celestial bodies that were symbolically important to the ancient Egyptian resurrection cult of Osiris, Isis and Horus, at specific angular altitudes relative to the observer's horizon. The core celestial bodies that are targeted comprise of five fixed stars and the planet Mars. The symbolic rationale of each is as follows. Sirius. Sirius is the brightest star in the sky and was of extreme importance to the Egyptians. Firstly, the date of its helical rising (i.e. when it rose just before sunrise) co-incided with the crucial Nile floods each year. Secondly, Sirius represented the goddess Isis, the consort of Osiris the god of resurrection and judge of the dead. After Osiris was murdered by his evil brother Set, it was Isis who performed the necessary magic to resurrect her husband, (µµµ). The star Sirius is also extremely important in the symbolism of Freemasonry, (click "stargate" µµµ). Orion's Belt Stars. To the ancient Egyptians the constellation of Orion the Hunter represented the god Osiris. The close grouping of the three stars of Alnitak, Alnilam and Mintaka form a distinctive line which forms a belt around Orion's waist. In their 1994 book The Orion Mystery the authors Robert Bauval and Adrian Gilbert put forward the theory that the three main pyramids at Giza were laid out to be a mirror (not a map) image of these three stars. Of course there is no way to prove this idea unless Egyptian artwork or hieroglyphs are found in which the people of the time say that this was indeed their intent. However, the truth of the matter is irrelevant - secret society followers of the Egyptian tradition may have noticed the correspondence between Orion's Belt and the Giza pyramids long before Bauval and Gilbert did. Regulus. Regulus is the brightest star in the constellation Leo the Lion. To the ancient Egyptians Regulus was the star associated with Horus who was the son conceived by Isis when she had sex with Osiris as part of the magic of resurrecting him. After Osiris withdrew to the Underworld to be ruler and judge of the dead, Horus ruled Egypt in his place. As a result Regulus was regarded as the star of kingship and is apparently the root of such words as regal, regalia, regent and regency. Mars. Mars was also apparently associated with Horus under his title "Horus the Red". (Mars is also, of course, the centre of TEM's investigations into possible off-Earth ruins). Since 1998 Hoagland and Bara also suspect that the hypothetical ritualists inside NASA have been targeting the comet Enke which is the shortest period comet with an orbit of only 3.3 years. Sometime in the last few thousand years Enke partly disintegrated. Some astronomers have theorised that the orbit of Enke is strewn with many "Doomsday" objects that hit the Earth from time-to-time, (µµµ). The other object that they think the ritualists have been targeting is the star EQ Pegasi which has a declination - the angular distance from the Celestial Equator - of 19.47 degrees. During 1998 this star was the centre of a well organised extraterrestrial first contact hoax, (click "stargate" for details µµµ). However, neither of these two objects will be included in this study. In the Hoagland & Bara model the Masonic style ritualists within NASA attempt to match space mission milestones with times of day when any of the celestial objects above are at specific angular altitudes relative to the horizon. These are as follows. Points on the Meridian. If an imaginary line is drawn from due North to due South over the observer's head then this is the astronomical Meridian that separates the western from the eastern celestial hemisphere. The 24 hour revolution of the Earth will ensure that all celestial objects - stars, planets, the Moon and the Sun - will transit (cross) this Meridian. When they do they are at their highest altitude in the Sky. This point is known as their Culmination. If we extend the Meridian below the observer's feet then when a celestial object crosses that part of the line it will be at its lowest point relative to the horizon. (For the purposes of this study this point will be referred to as the Nadir, even though this isn't the proper astronomical meaning of the term). To the ancient Egyptians and to the Freemasons the splitting of the celestial hemisphere into East and West by the Meridian symbolised dualities such as life & death, light & dark ,etc. Masonic ceremonies are always said to take place when the Sun is at its Meridian, even at night, because somewhere in the world-wide Brotherhood it will be. The Horizon / 0 Degrees. To the ancient Egyptians the horizon symbolised the transition between this life and the next. Plus or Minus 19.5 Degrees. In Richard Hoaglands model of hyperdimensional physics massive rotating systems produce significant hyperdimensional effects, including the tapping of zero point energy. According to Hoagland some of this hyperdimensional upwelling of energy is directed into 3-D space in accordance with tetrahedral geometry. If an imaginary tetrahedron is circumscribed inside a spinning celestial body with one point attached at a pole, then the other three points of the tetrahedron will touch the surface at 19.5 (19.47) degrees latitude. It has been observed that this latitude is often associated with hot spots on the surfaces of planets within the Solar System, (click "stargate" for details µµµ). TEM believe that this knowledge has been passed down through secret societies from some mysterious ancient source. Hyperspace is certainly something that would interest sections of the esoteric movement. The reading list for new members in Aleister Crowley's secret society the A.'.A.'. includes C. Howard Hinton's The Fourth Dimension (µµµ). Plus or Minus 33 Degrees. The highest degree of initiation in the Scottish Rite Freemasons is the 33rd. The number 33 seems to have been a magical number since ancient times. TEM have argued that the number 33 can be derived from the geometry of a tetrahedron circumscribed within a sphere - but their mathematical explanation for this seems too contrived. C Mary Anne Weaver's Probability Study TEM's theory has already been put to the test in 1999 by Mary Anne Weaver. Weaver's probability analysis covered American space programmes between 1958 and 1978 which had some involvement with Lunar exploration. This study not only studied star alignments over Cape Canaveral at the time of rocket launches, but also over sites in the Hoagland/Bara model referred to as "Temples". Giza is the most famous of these "Temples". However, the "Temple" sites also include some of the Apollo landing sites on the Moon that were chosen by the enigmatic NASA consultant Dr. Farouk El Baz, (µµµ). TEM have yet to explain the significance of the "Temple" sites at the time of writing. Weaver failed to find a significant number of alignment "hits" over Cape Canaveral at launches, but did find a statistically significant number over the "Temple" sites, which were especially concentrated on the star Sirius. Attempting a statistical probability study combining several different locations on two different planetary bodies is of astonishing complexity. In 2003 Weaver decided that the methodology used in her paper did not sufficiently overcome these complexities to support firm conclusions. It is for these reasons of complexity that this Cydonia Quest statistical study confines itself to a single location - the sky over the launch site. This reduces the problem to the most simple and transparent type of statistical probability analysis. Mary Anne Weaver's full study can be read by clicking on the next "stargate", µµµ and for the abstract µµµ. C The Space Shuttle Launch Study
|
| Weaver's study was concentrated in the "right stuff" era of the American space programme. It was always possible that as the original management of NASA left the scene that their astrological rituals left with them. In order to ascertain whether somebody is still attempting to ritualise operations at NASA this new study analyses the 107 space shuttle launches between April 1981 and December 2001. The Space Shuttle is such a complicated piece of machinery with so many things that can go wrong (and so many things that can give false alarms) that it is very rarely launched on schedule. Any hypothetical ritualists in NASA management would therefore face an uphill struggle to launch shuttles when the target stars are at the correct altitudes. However, if anybody behind the scenes is attempting to do so, then there will be a statistical signal within the otherwise random "noise". This study will use three methods to look for this signal. Firstly, it will look at the distribution of altitudes of the target stars for the 107 launches. If targeting is taking place then we would expect to see some clustering of the data around the target altitudes, even if there doesn't seem to be many alignment "hits" within the data. Secondly, it will take an arbitrarily chosen definition of an alignment "hit" and compare the number of actual "hits" in the data with the number of "hits" we know that there should be. Finally, it will undertake some probability analysis of any deviance of actual alignment "hits" from expected "hits". The source of the shuttle launch data that was used in this study can be found by clicking on the NASA graphic below which has been hyperlinked.
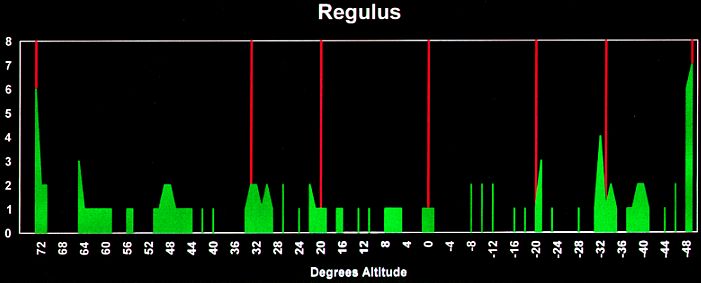
c Due to time constraints this new study only looks at the sky over Cape Canaveral at the times of shuttle launches. It can be disclosed in advance that whereas Mary Anne Weaver's study found little significant evidence of alignment targeting over the actual launch site, this one finds a clear signal. Whereas Weaver's study finds a clear bias towards the star Sirius this one finds a distinct bias towards the star Regulus. We will therefore begin by examining the data for Regulus. c Regulus Chart 1 shows the range of altitudes that Regulus passes through in every 24 hour period. Unlike the altitude of the Sun's culmination, the culmination and nadir altitudes of the fixed stars do not change from day-to-day and from season-to-season. They only change very slowly with the 26,000 year wobble in the Earth's axis known as precession (and over a longer period with each star's proper motion as it orbits the centre of the galaxy). The chart records the number of times that Regulus was to be found within specific one degree wide "slots" of altitude (e.g., +32o to +33o) when the 107 shuttles were launched. The vertical red lines show the positions of the culmination, nadir, horizon, +/-33o and +/-19.5o altitudes. Chart 1
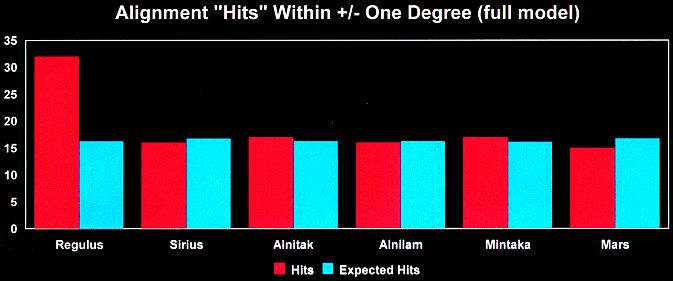
c It can be seen in Chart 1 that the altitude data for Regulus is not entirely random. It tends to cluster together and there are a number of spikes in the chart. It can also be seen that every one of the target altitudes has "attracted" shuttle launches. The biggest spikes in the chart are associated with Regulus's highest and lowest altitudes during the day. However, it is also the case that at Cape Canaveral's latitude the target stars spend a great deal more of their time close to their culmination and nadir altitudes than they do for the other target altitudes. For example, the time Regulus spends within one degree of its culmination is nearly three times as much as it does within one degree of the horizon. So are the data spikes near to the culmination and nadir just because Regulus spends a high proportion of its time near these altitudes? The most prominent data spike in the chart is around Regulus's nadir. For the time it spends within one degree of the nadir altitude we would expect to get an average of 5.6 "hits" for Regulus for every 107 shuttle launches. Yet the actual number of hits from the first 107 space shuttle launches is 12, i.e., twice as great. Another feature of interest in Chart 1 is the two prominent spikes that are near misses on -19.5o and -33o. The overall impression from Chart 1 is that there was an attempt to launch space shuttles to produce alignment "hits" on Regulus. The reader may wonder about the spikes in the chart that are not associated with one of the red lines indicating a target ritual altitude. Well, it must be remembered that the fixed stars are just that - fixed in relation to one another. If any of the other fixed stars in the Hoagland/Bara model are recording a data spike at a target altitude then this will be reflected in a corresponding data spike for Regulus. For example, as Alnitak, Alnilam and Mintaka descend through the horizon Regulus is at approximately +64o. Similarly, when this trio of stars descends through -19.5o Regulus is at +45 to +47o. Reference to Chart 1 reveals that there are indeed data spikes for Regulus around these altitudes. Data spikes of this sort need not even result from "hits" on another star at Cape Canaveral. A cluster of "hits" at one of Hoagland and Bara's "Temple" sites - as long as it was situated on Earth - would produce a similar result. Having explored the suspicious distribution of altitudes for Regulus during the first 107 space shuttle launches, this seems an opportune time to look at the "hit" statistics in this study. C The Space Shuttle "Hit" Statistics One of the useful features of the RedShift 3 software that was used for this study is its minute-by-minute animation and altitude read out features. With this it is a fairly easy task to count up how many minutes of the 1,440 minutes in the day each star spends within target altitude bands. For the purposes of this study an alignment "hit" is defined as when one of the target bodies is within one degree altitude of one of the target altitudes. The results for the full range of target bodies and altitudes is shown in Chart 2. It can be seen that Regulus had twice as many actual hits (32 as against an expected average of 16.3) than was to be expected. All the other target bodies scored very much as expected. (Note: As the culmination and nadir altitudes of Mars are subject to change from day-to-day the highest and lowest altitudes for that planet on the day of each launch was used in this study). Chart 2
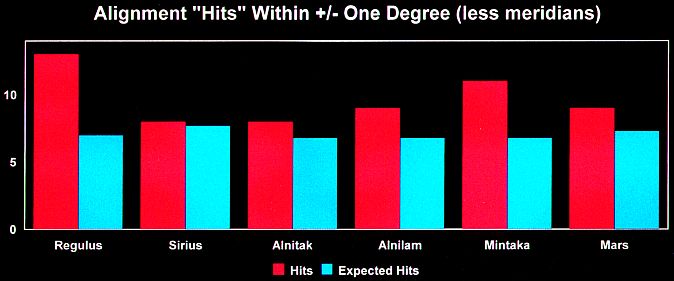
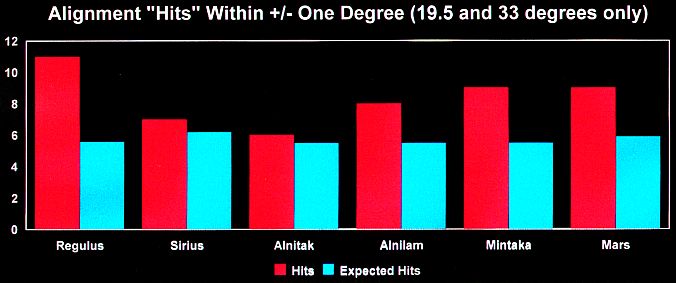
C Regular readers of the TEM web-site will know that they very rarely use examples of alignment "hits" in their articles that involve target stars at their highest and lowest altitudes. This is because they prefer a target body to be right on the Meridian before they call it a "hit". They also like to emphasise alignment "hits" that involve 19.5o and 33o. It therefore seemed a good idea to drill down through the data to this core version of Hoagland and Bara's model. In Chart 3 the data is re-analysed to look for only "hits" on the horizon, +/-19.5o and +/-33o. It can be seen that Alnilam, Mintaka and Mars have "hit" results higher than is expected from the length of time they spend within one degree of these altitudes. If we go further and just look at "hits" on +/-19.5o and +/-33o as shown in Chart 4 the results for the fixed stars are much the same as in Chart 3, except the surplus of actual "hits" over expected "hits" for Mars has increased. This suggests there are indeed a group of people within NASA with a special interest in targeting the altitudes associated with the numbers 19.5 and 33. The prominence of Regulus and Mars in Chart 4 seems to indicate a symbolic bias towards the Egyptian god Horus. Charts 3 & 4
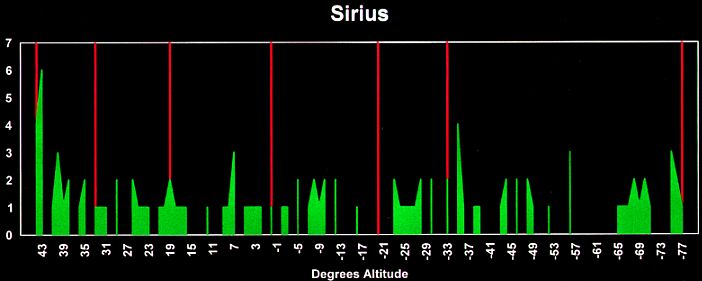
c If we take the five fixed stars in the Hoagland/Bara model (excluding Mars) then we find that the excess of actual "hits" over the expected alignment "hits" is in the order of 20% for the data in Chart 2. In Chart 3 the excess over actual "hits" is 40% and in Chart 4 the figure is 45%. This is a very strong upward bias in the "hit" statistics for the launch data. It is even more significant that none of the celestial objects in this study show a marked undershoot of actual "hits" over expected "hits". If the distribution of the altitude data were truly random then big undershoots in "hit" numbers are just as likely as big overshoots. So just how unlikely are the results seen in Charts 2, 3, & 4. c Some Probability Analysis of the "Hit" Statistics This investigator's mathematical skills are not as good as Mary Anne Weaver's so I will refrain from attempting to estimate the exact probabilities for the "hit" statistics. However, as we already know the number of "hits" to be expected we can arrive at reasonably accurate estimates by using an easy to calculate measure known as the standard error, which can be read against a statisticians' probability table. It all relies on the statisticians' discovery that large and truly random samples of data create a distinctively proportioned distribution curve - the standard normal distribution curve, more popularly known as the "Bell Curve". The curve works like this. If we imagine that there were a near infinite number of parallel universes in which 107 space shuttles were being randomly launched, then we would find that in the majority of these universes the actual number of "hits" would cluster around the expected number of "hits". However, as we moved out into bigger overshoots and undershoots of the expected "hits" figure we would find that the number of universes where shuttle launches were displaying such behaviour would become rapidly smaller. The standard error is the deviation from the expected "hits" figure that when applied as a plus and minus range to that figure includes the results in 68% of our imaginary universes. The standard error for the Regulus data in Chart 1 is approximately 3.7 and the expected number of "hits" was 16.3. So, in 68% of the imaginary universes the average number of actual "hits" recorded will be between 20 and 12.6 for every 107 space shuttle launches. By the same token in 16% (i.e. 32% / 2 = 16%) of the universes the number of actual "hits" will be greater than 20 and in another 16% the figure will be less than 12.6. The formula for calculating the standard error is as follows- The square root of ((The proportion of the time a "hit" is expected) x (The proportion of the time a "miss" is expected) x (The number of observations). As we expect a "hit" 0.152 of the time, a "miss" 0.848 of the time and the number of observations was 107, then this translates into - The square root of (0.152 x 0.848 x 107) = 3.714 Now the number of "hits" for Regulus in Chart 2 was 32 giving an overshoot deviation from the expected figure of 16.3 of 15.7. If we divide the 15.7 overshoot by the standard error then we can say that this upside deviation is equal to 4.23 standard errors, (i.e. 15.7 / 3.714 = 4.23). This figure can then be compared with the statisticians' probability table where the probabilities against chance rise exponentially the greater the number of standard errors. I've discovered a useful website that converts standard errors into probabilities, (click "stargate" to access µµµ). This gives the probability of either a downside or upside deviation of greater than 4.229 standard errors as 0.00002349 - or one chance in 42,571. As we are only interested in the probability of a standard error of greater than 4.229 above the expected number of "hits" the actual probability is one chance (or universe) in 85,142, (i.e. 42,571 x 2). Of course this 85,142 to one probability is specifically for Regulus. The level of overshoot in Regulus's "hits" statistics could have occurred with any of the six celestial objects under study. So the chances of any of our celestial objects showing the level of upward bias that Regulus did is approximately 85,142 divided by six - or one chance in approximately 14,190. If we take the "hit" statistics for all six celestial objects in Chart 4 then the expected number of hits was 34.2 against an actual "hits" count of 50, giving an upside deviation of 15.8. The number of observations was 642 (i.e. 107 x 6), the proportion of time were a "hit" was expected was 0.0535 and the proportion of time were a "miss" was expected was 0.9465. From these figures the standard error that is derived is 5.7. Our upside deviation is thus equal to approximately 2.77 standard errors at which point the probability of such a deviation are about one chance (or universe) in 356. These probability figures therefore confirm what we are seeing in the charts - that there is a very large upward bias in the actual "hit" results over the expected results. Let is now go back and look at the altitude distribution charts for the other celestial objects in this study. C Sirius Given the importance of the star Sirius to so many secret and occult societies its poor showing in Charts 2, 3 & 4 is very surprising. This impression of a lack of interest in Sirius by the hypothetical ritualists at NASA is reinforced by the altitude distribution data for Sirius during the 107 space shuttle launches shown in Chart 5. Only Sirius's culmination altitude and +19.5o shows any really strong evidence of targeting. Chart 5
c An explanation for Sirius's relatively poor showing can be found in the extreme bias towards the apparent targeting of Regulus. Chart 6 shows were the fixed stars of Sirius, Alnitak, Alnilam and Mintaka are in the Cape Canaveral skies as Regulus passes through each of the target altitudes in the Hoagland/Bara model in every 24 hour period. When a star is within 0.5o of a target altitude it is coloured thus, within 1o of a target altitude this colour is used, and within 1.5o this colour. As can be quickly seen, the three stars of Orion's Belt have a strong synergetic relationship with Regulus. Targeting Regulus also affords many opportunities to target Alnitak, Alnilam, and Mintaka. On the other hand Chart 6 clearly shows that if Regulus is the object of targeting then Sirius will record very few "hits". In fact Charts 2, 3 & 4 should really have shown a marked undershooting for Sirius of actual "hits" compared to expected "hits" on this basis. So there must have been more targeting of Sirius than first appears with the result that the Sirius figures have been evened upwards. (Note: Arc Minutes in Chart 6 have been converted into decimal fractions of a degree). Chart 6
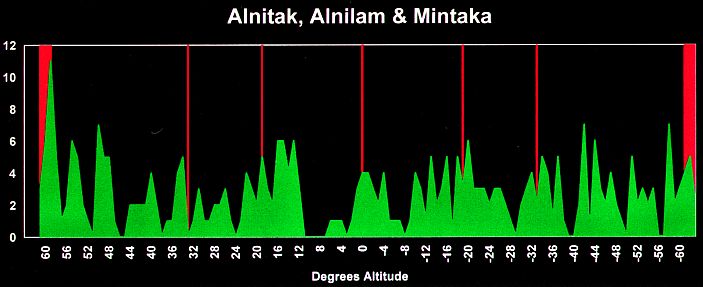
C Important note. It should be noted that the existence of these synergetic relationships between "hits" for Regulus and "hit" opportunities for the stars of Orion's Belt does not have any affect on the number of expected "hits" seen for each individual celestial object or for all the stars collectively. The relationships will however create "hit" rich periods in the day (offset by "hit" poor periods). The reader may therefore be thinking that the excess of "hits" seen in Charts 2, 3 & 4 may be due to NASA having a preference for launching shuttles at a "hit" rich time of day and that the upward bias in the number of "hits" is entirely co-incidental. Leaving aside the random looking nature of the times of space shuttle launches, there is a fundamental flaw with this theory. Due to the Earth's movement in orbit around the Sun, the fixed stars rise and set an average of two hours earlier each month. Thus if a hypothetical star were at +33o altitude at 8.00 a.m. on a particular day, it would be at a very different altitude at 8.00 a.m. even a few days later. The best analogy for the apparent movement of the fixed stars in our sky is to think of the tumblers on a "one armed bandit" machine in an amusement arcade, pub or (for American readers) casino. In such a machine the tumblers spin at different speeds allowing a large number of combinations of fruits, but few winning combinations. In terms of the fixed stars we have one tumbler revolving every 24 hours and another revolving every 365.25 days. In the case of Mars there is a third tumbler that has a variable rate of spin and which can even change its direction of spin on occasion. So the only way to totally ensure an excess number of "hits" is to deliberately target the relevant star alignments - which is exactly what Hoagland and Bara are claiming that somebody at NASA is doing. C Alnitak, Alnilam and Mintaka As the three stars of Orion's belt move around the sky together it seemed logical to combine their altitude distribution statistics during the 107 space shuttle launches into a single chart. As a result Chart 7 has a much denser appearance than the comparable charts because it contains 321 observations rather than just 107. The three stars have slightly different culmination and nadir altitudes so these target altitudes appear as a red band in the chart. Overall, with the exception of the nadir, Chart 7 seems to indicate that a hypothetical somebody was trying to target all the relevant altitudes in the Hoagland/Bara alignment model. Reference to Chart 6 reveals that many of the spikes in Chart 7 seem to be the reciprocals of alignment "hit" clusters in the Regulus data. Chart 7
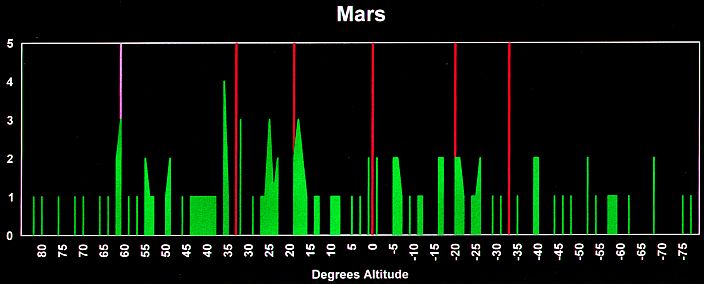
c Mars Whereas the fixed stars have rather fixed culmination and nadir altitudes, those for Mars change from day-to-day depending on a combination of the season and where Mars is on its orbit relative to the Earth. The path of Earth's orbit is traced across the sky by an imaginary line called the Ecliptic which passes through all the zodiacal constellations (which is what makes the Zodiac the Zodiac). Logically, the apparent path of the Sun through the sky each day follows the line of the Ecliptic. The combination of the Earth's tilted axis and its orbit around the Sun means that when an observer's polar hemisphere is pointed towards the Sun then the ecliptic is high above the horizon during the day and low relative to the horizon at night - and vice versa for when the polar hemisphere is pointed away from the Sun. (Hence the seasonal variation in the Sun's culmination & nadir altitudes - and in the length of the day, modulated by the observer's latitude). Now, Mars orbits in nearly the same plane as the Earth, so it also is to be found on the line of the Ecliptic. If Mars' position relative to the Earth is in the direction of the Sun then its variable culmination and nadir behaviour will be the same as that for the Sun and it will be a day-time object. However, if Mars' orbit carries it in the opposite direction from the Sun relative to the Earth then it will be a night-time object with a culmination and nadir behaviour that is the opposite of the Sun's. The above lengthy description explains why there are no red vertical lines indicating culmination and nadir altitudes for Mars in Chart 8 - these just change from day-to-day. It also helps explain the purple vertical line. This indicates Mars' culmination altitude at its "equinox", i.e. on those days when it spends as much time above the horizon as it does below it. Mars' "equinox" culmination is at nearly 62 degrees above the horizon and it is interesting that there should be a pronounced spike in the altitude data at just this point. It seems to be more than a co-incidence. Being a moving planet, Mars altitude data is not affected by "hit" clusters in any of the fixed stars. As a result most of the data follows more of a flat and even distribution across the chart. However, there are notable spikes at the "equinox" altitude and at plus and minus 19.5 degrees. There also seems to have been an attempt to target the horizon by our hypothetical ritualists. The prominent spikes at +32o and +35o also suggest a concerted effort to target +33o. The big mystery is the data spike between +25o and +26o. Was it just a random blip, or was there an attempt to target the architectural golden angle (used since ancient Egypt) of 26 degrees? Chart 8
c A Small Speculation About Mars and the Zodiac. This study was done with the sky magnification setting on RedShift set quite high. I was therefore surprised at the proportion of times when a reading was taken for Mars that it was in close proximity to one or more planets in the sky. Looking at the "events" finder on RedShift reveals that such planetary conjunctions are not uncommon for Mars. As I haven't given any thought on how to determine whether what I had observed was above chance, and because it does not fit in with an Egyptian theme I've decided not to follow this line of inquiry. However, I thought it was worth mentioning anyway as it is always possible that the hypothetical ritualists also use more conventional forms of electional astrology.
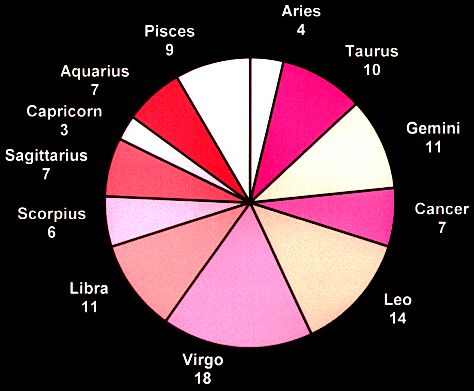
The observations in the above paragraph did open a line of thought concerning the zodiacal constellations which Mars (as an ecliptic object) is confined to. Some of these that are close to the region in the sky that the ancient Egyptians called the Duat could have symbolic meaning to the ritualists, leading them to concentrate spurts of space shuttle launches when Mars was in these constellations. We have already seen for example that in esoteric astrological circles Virgo is associated with the Egyptian goddess Isis. Horus's star of kingship Regulus is in Leo. The two zodiacal constellations with boundaries with Osiris's constellation Orion are Gemini the Twins and Taurus the Bull. Taurus apparently has associations with Osiris's fratricidal brother Set and one of Horus's titles was "Horus the Mighty Bull". The Gemini twins could symbolise the brothers Osiris and Set in some peoples' minds. Chart 9 sets out the results of where Mars was in the Zodiac when each space shuttle was launched. (Note: Precession has intruded a 13th constellation into the Zodiac - Ophiuchus the Serpent Bearer. On the few occasions when Mars was in this constellation it was assigned to the nearest constellation in the traditional Zodiac. Libra was the main beneficiary of this rule). Chart 9 c As can be seen Virgo, Leo, Gemini and Taurus with 53 "hits" account for 49.5% of the readings in Chart 9. However, not all the constellations of the Zodiac span the same length of the ecliptic. These four constellations are sky hoggers taking up 40% of the length of ecliptic, meaning that Mars will also spend 40% of its time within their boundaries. There is, though, still a small bias towards the relevant zodiacal constellations, which could feasibly be brought about by careful planning of shuttle maintenance "down time" to allow more launches in "hit" rich periods. The high score for Libra the Balancing Scales is also quite interesting. In ancient Egyptian lore the souls of the departed were weighed against a feather on a set of balancing scales to determine whether they had led a virtuous life. C Conclusions This study of star alignments during space shuttle launches shows a strong bias towards the Egyptian/Masonic model of Richard Hoagland and Mike Bara. This is an objective fact. It is when we try to interpret this result that we must resort to reasonable judgement - and the judgement of reasonable people can be different. It could be that this confirmation of the Hoagland/Bara model is just a fluke. However, given that Mary Anne Weaver's study also showed a strong bias in NASA's operations towards this model in the earlier 1958 to 1978 period I am less inclined to ascribe the results of this new study to chance. Cydonia Quest will therefore be adopting the working hypothesis that there has been an esoteric group working within the American space programme since its earliest days attempting to ensure that NASA operations have been run to Masonic style ritual. After all, far stranger things have happened in the American space programme than a bit of electional astrology, (see µµµ). It is also probably not too big a leap of judgement to suggest that for this ritual to succeed to the extent seen in this study that some members of this group hold key managerial positions. To what extent the beliefs of this esoteric Masonic style group has influenced NASA policy on issues such as Cydonia is a matter of opinion and not one that this or Mary Anne Weaver's study can answer. Some Further Speculations on the Symbolic Bias Towards Horus in the Data. It has already been noted above that the celestial objects associated with Horus (Regulus and Mars) score well above chance in the alignments data. The particularly strong showing from Regulus could be just a practical issue that targeting this star allows opportunities to also target Alnitak, Alnilam and Mintaka as seen in Chart Six. However, there could be more symbolic reasons. A wide range of New Agers, Theosophists and secret society types believe we are on the brink of a major change in the Earth and human consciousness (if even only perhaps for an initiated few). This new era goes under different names such as the "Age of Aquarius", the "New Age" of the Freemasons and "the new world order" of Alice Bailey. Aleister Crowley called it the "Aeon of Horus" when magi-ickians would rule the Earth. It may be that our hypothetical ritualists at NASA are also awaiting these changes and find Crowley's Aeon of Horus very apt for their Egyptian style symbolism. Another (and not exclusive) possibility is that as Regulus is the star of kingship that they take seriously the prophecies of Alice Bailey and Edgar Cayce that a new "Christ" like figure is about to emerge onto the World scene. C µ Return to The Conspiracy Latest Developments µ Click "stargate" to return to The Conspiracy Part Three µ Return to the Cydonia Quest main page
|