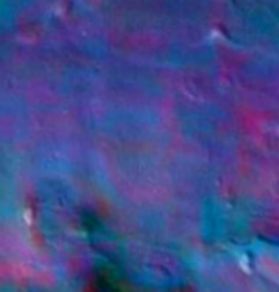
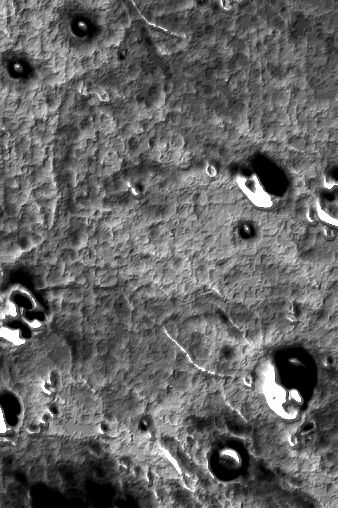
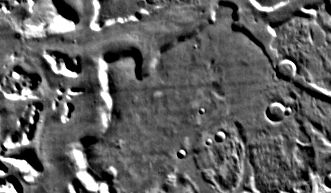
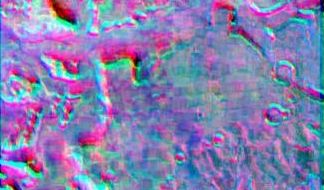
Cydonia Quest The Occasional Journal C Entry No.2 - 24th November 2002 The Leaked Cydonia Infrared Image Controversy - Part 2 There were a number of problems with the grid-like thermal patterns seen in Keith Laney's decorrelation stretch images using the leaked "real" set of Cydonia IR images. Why did they cover every featureless piece of level ground, and why did some of them follow the few scan line streaks that had remained in the "official" images on the Mars Odyssey website? As a first stage in investigating the "real" images the best idea seemed to be to see if any of the grids seen in Laney's decorrelation stretch images actually had any surface counterparts in an earlier visible light image of Cydonia taken by Mars Odyssey. I was drawn to an area between Bright Mounds E, D and B that is called the "Grill" in the pages of Cydonia Quest. Further details can be read by clicking this "stargate" µµµ, but basically it is an area where the ground is being gradually swallowed up by a grid-like arrangement of pits, which may indicate buried or underground former habitation. Laney's overlays of decorrelation stretch results from the "real" IR image onto this visible light image did seem to reveal that this rather level area did have large scale rectilinear undulations. By using high contrast and a little blurring it was possible to exaggerate these hardly discernible undulations so that their true pattern became apparent. As the images below show there is a high correlation between these grid-like undulations in the lie of the land in the "Grill" area in the visible light image (centre) and the grids seen in Laney's decorrelation stretch IR images (top and bottom).
|
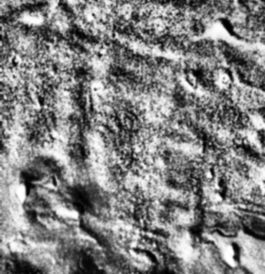
| c ccccccccccccccccccccccccccccc cccccccccccccccccccccccccccccc cccccccccccccccccccccccccccc c So in this area, at least, the grid patterns seen in the decorrelation stretched images of the "real" set of IR images correspond to actual geometrical surface features that cover more than four square miles of ground. An extended analysis of the findings summarised above can be read by clicking on the following "stargate" µµµ. Having established that the lie of the land on the southern fringe of the Cydonia plain did match the "real" IR decorrelation stretch images, was it now safe to extrapolate this finding to the vast sweep of plain to the north? The publication of a second daytime IR image of Cydonia in October seemed to offer a clue. This covered a larger area than the multispectral image set released in July, but overlapped extensively with them. It was, however, in a raw format with a hatch pattern of scan line streaks intermeshed with the underlying image. (Click this "stargate" µµµ for the image). After enhancement it did seem to me that this image did contain evidence of a thermal grid pattern to the west of the "Fort". Unfortunately though, I could not suppress the noise of the scan line streaking to be sufficiently sure. Now, as the first "official" IR multispectral images released on the 24th July had been processed to remove most of this kind of scan line streaking I decided to go back and see what could be found in them. After examining the nine image bands in the 24th July image release, I decided that the 7.88 um band image did show signs of an underlying thermal grid in the plain north of the "Grill" area. After contrast enhancing and conversion to a BUMP map image it was apparent that over a large area there was an underlying grid pattern in the "official" images that corresponded somewhat to the one seen in Keith Laney's ENVI processed "real" IR images. The illustration below on the right gives an example of a BUMP map enhancement of the area. It can be seen that the grid patterns have the same north-south and east-west alignments of the grid that exists in the "Grill" area - and those seen in the ENVI processed "real" images. The illustration below on the left we will come to shortly. (Note - A BUMP map creates a three dimensional effect out of an ordinary image based on differences in relative brightness in the image). c
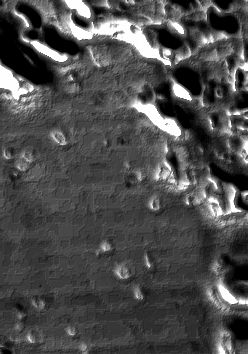
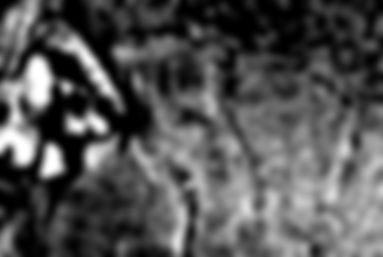
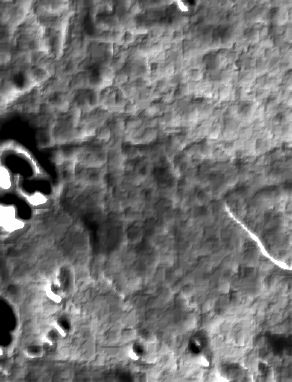
So, how can we be sure that the roughly rectilinear cells in the illustration above are not just amplified noise in the "official" version of the 7.88 um band image that I chose for this exercise? Well, the best solution is to compare the location shown above with part of the image with a comparable flat area that does not exhibit evidence of such rectilinear cells. The control area chosen (above left) is the featureless plain at the extreme bottom left hand corner of the "official" image, (see µµµ). If we compare the BUMP map of this control area with the similar BUMP map for the plain between the "Fort" and the "Face" we see that the two areas are very different in 3-D appearance. In the control area "blockies" follow slightly sloping "tramlines" set by the residual traces of the scan line noise. (If you stand away from your computer these scan lines will become easily apparent). The square'ish "blockies" also have a very shallow looking 3-D appearance. In the case of the "Fort" and "Face" area the rectilinear cells do not align with the downward (right to left) slope of the scan lines - and instead of "blockies" we see a rectilinear arrangement of thermal "walls". These "walls" in turn have a greater 3-D depth and solidity in the BUMP map than is the case for the control area. If both of the images above are smoothed or blurred gradually at the same rate, then the "blockies" in the control area disappear long before all of the "walls" in the "Fort" and "Face" area do. So we can be confident that much of the rough grid seen in this area corresponds to something real in the infra-red and are not noise artefacts. An extended report on the thermal grids found in the "official" IR images of Cydonia can be perused by clicking the next "stargate" µµµ. This is all very relevant to the Enterprise Mission's championing of the ENVI decorrelation stretch results from the leaked "real" IR images. It isn't just these leaked images that are showing a thermal grid, but the "official" versions are too. However, the control area image above is also warning us that there is an underlying "blockie" noise in the original data that underpins both the "real" and "official" IR image sets. This is showing up as false grid patterns in many or most parts of the "real" image after decorrelation stretching. An example of this false grid effect is shown in the two images below. In the first illustration, which is taken from the "official" IR image, we can see some very prominent scan line streaks that Noel Gorelick has not been able to lift out of the picture. These are visible as faint dark lines sloping slightly down from right to left. The second illustration shows the same area taken from Keith Laney's decorrelation stretched image using the "real" IR image set. It can be seen that the rows of rectilinear cells in the ENVI processed "real" image follow the slope of the scan line streaking, and actually seem to be guided and bounded by them. Now my conclusion (to which the reader is free to disagree) is that this is because these particular grid patterns are artefacts created by an image enhancement/filtering process that was applied to the "real" images before they were leaked to Keith Laney. C cccccccccccccccccccccccccccc
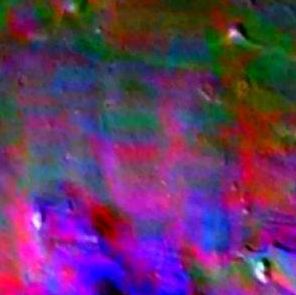
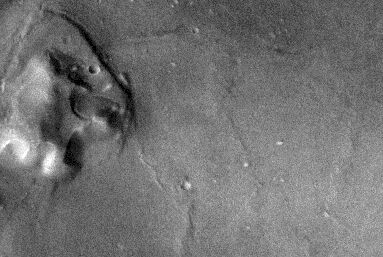
cccccccccccccccccccccccccccc C The answer to the question (asked at the beginning of this journal entry) as to why every piece of flat, featureless ground has a grid pattern in the ENVI processed "real" image; and to why many of the grids follow the slope of the scan lines has now been answered. It is because many of them are artefacts and not real thermal features radiating from the surface of Cydonia. Part Three of this investigation will explore one possibility of what the filtering process was that seems to have been applied to the leaked "real" images. Life would have been very much easier for members of the Cydonia anomalies community if this filtering had not been applied to the "real" images before they were leaked. (Whistle blowing "Roosters" please take note). The more sceptical reader is no doubt thinking in regard to the thermal grids that have been identified in the "official" version, that they might just be another kind of imaging artefact. In order to assuage such qualms I therefore went back once again to the visible light image of Cydonia to see what image enhancement might tell us about faint surface features in the area. The first image below shows the area to the east of the "Fort" as it appears after contrast and brightness optimisation. The second image shows the same area after ultra-contrasting and blurring to get rid of extraneous detail. The resulting patterns of light and dark are probably due to subtle differences in the elevation or reflectivity of the land as it catches the Sun. The geometric quality of the landscape is very striking, especially the box shaped features close to the "Fort" itself. (Images best viewed about four feet from computer screen). These box like features are of a size and positioning that matches up with those seen in the BUMP map image of the "official" IR image. The general north-south and east-west alignments are also in evidence. There is not an exact line-by-line match, but it must be remembered that the visible light image has a resolution five times greater than the infra-red one - and that the IR image is bound to be picking up things that are different from those seen in visible light. c cccccccccccccccccccccccc cccccccccccccccccccccccc ccccccccccccccccccccccccccccccc c An extended report on these interesting subtle surface features to be found in the visible light image of Cydonia can be read by clicking the next "stargate" µµµ. This concludes the summary of Cydonia Quest's own analysis into the veracity of the "real" Cydonia daytime infra-red image. In light of the corroborative evidence on this page, the faith that the Enterprise Mission has placed in the essential message of the "real" IR images has not been entirely misplaced - even if I disagree with them about the illusory role of imaging artefacts in the "real" image. There are indeed geometrical patterns of grids underlying the surface of some parts of the Cydonia plain. The argument should no longer be about their existence or not, but what their existence contributes towards the evidence of artificiality on Mars. Readers who have read Cydonia Quest's pages extensively will have no doubt that I view the evidence in the official infra-red images as very significant indeed. That being said we must also acknowledge that the "leaked" IR images pose some methodological problems. If the quality of Cydonia IR data that is released officially does not improve then we will not have comparative benchmarks by which to interpret the exact details of the image. As an analogy, the first Mars Global Surveyor image of the "Face" was taken at a fairly low resolution, through the hazy remnants of a dust storm and at an angle of 45 degrees from the vertical. If we had been unaware of these details and there had been no comparative images then our image interpretation of this "Face" image might have contained some flaws. Although I would like to see harmony reigning over the "real" IR images, this factor will ensure that there will be bad tempered debate even if the existence of the verified IR grid patterns are accepted by all Cydonia researchers. µ Click this "Stargate" to proceed to Part Three µ Click this "Stargate" to return to Part One µ Click this "Stargate" to return to Journal main page
|