 Cydonia Quest C Image Enhancements C Further Experimental Analysis of the First Infra-red Image of Cydonia Part One C Since Cydonia Quest published its first take on the daytime multispectral infra-red (IR) image set of Cydonia (see µµµ) the debate has been dominated by the leaked (or "real") set of IR images that have been analysed on the Enterprise Mission website, (µµµ). We have already seen previously (click µµµ) how helpful this analysis was in finding faint rectilinear surface features on Mars Odyssey's visible light image of Cydonia. Since then Cydonia Quest has been following the line of inquiry that the thermal grids, seen in the plains areas of Keith Laney's ENVI processed versions of the "real" IR images, will be hidden somehow in the individual "official" versions of the same images. In late October 2002 a second daytime IR image of Cydonia was released that was taken on the 8th March. This image seems sharper than the first IR image and appears to show some kind of a thermal grid west of the "Fort". However, as this link shows (µµµ) the image has pronounced horizontal scan line streaking - and to a lesser extent some vertical streaking as well. I don't have the necessary software to lift this streaking out of the image, but I have used a heavy blur filter to suppress them as much as possible in the highly contrast enhanced segment of the image below. The mounds of the Cydonia "City", "Face" and D&M Pyramid are all contained within the boundaries of the image as very bright, washed out objects. The scan line streaks still appear in the image as dark or light lines crossing the picture horizontally. However, behind this pattern of interference it seems to me that there are parts of the Cydonia plain where there are partial rectilinear grid patterns in the infra-red. Unfortunately the amount of blur applied makes the image very crude, with little fine detail and the effect is not convincing in this case.
|
| c
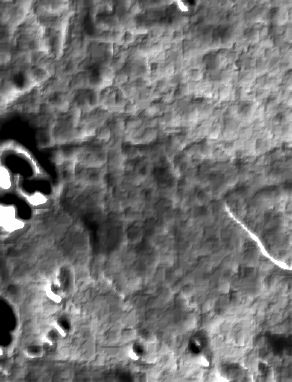
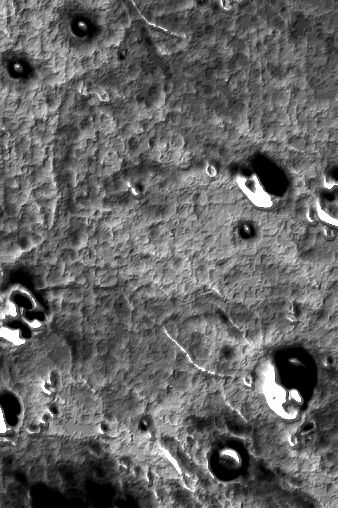
c Now, as the first IR multispectral images released on the 24th July had been processed to remove most of this kind of scan line streaking I decided to go back and see what could be found in them, (see µµµ). As you can see from the contrast enhancement (below left) and its BUMP map version (below right) there does indeed appear to be a grid pattern close to the "Fort" that corresponds somewhat in spirit to the one seen in Keith Laney's ENVI processed images for the Enterprise Mission. Addendum: 26th January 2003. It should be added that although the thermal grid seen close to the "Fort" is superficially similar to the one seen in the Enterprise Mission's enhancements of the "real" IR image, the grid seen in the "official" image does not match up well with the grid seen in the "real" image. The thermal grid evident in this part of the official version of the image cannot, therefore, be used to show whether the "real" IR image is authentic. (Note - A BUMP map creates a three dimensional effect out of an ordinary image based on differences in relative brightness in the image).
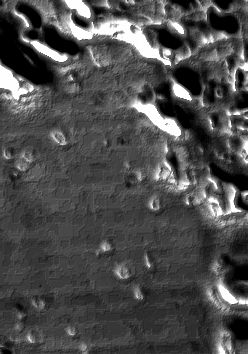
c So how can we be sure that the roughly rectilinear cells in the illustrations above are not just amplified noise in the "official" version of the 7.88 um band image that I chose for this exercise? Well, the best solution is to compare the location shown above with part of the image with a comparable flat area that does not exhibit evidence of such rectilinear cells. The control area chosen is the featureless plain at the extreme bottom left hand corner of the "official" image, (see µµµ). If we compare the BUMP map of this control area with the similar BUMP map for the plain between the "Fort" and the "Face" we see that the two areas are very different in 3-D appearance. In the control area "blockies" follow slightly sloping "tramlines" set by the residual traces of the scan line noise. (If you stand away from your computer these scan lines will become easily apparent). The square'ish "blockies" also have a very shallow looking 3-D appearance. In the case of the "Fort" and "Face" area the rectilinear cells do not align with the downward (right to left) slope of the scan lines - and instead of "blockies" we see a rectilinear arrangement of thermal "walls". These "walls" in turn have a greater 3-D depth and solidity in the BUMP map than is the case for the control area. If both of the images below are smoothed or blurred gradually at the same rate, then the "blockies" in the control area disappear long before all of the "walls" in the "Fort" and "Face" area do. So we can be confident that much of the rough grid seen in this area corresponds to something real in the infra-red and are not noise artefacts.
C C C C c Perhaps we should not be too surprised that there are ghostly grid-like infra-red traces emitting from the plains surrounding the best known Cydonia anomalies. Other commentators such as Mark Carlotto have drawn attention to the remarkable degree to which many of the small bumps and hills to the south of the D&M Pyramid are arranged around grids of ruler straight lines. This effect can be seen very effectively in this BUMP map that I have prepared from the first daytime IR image of Cydonia, just click the next "stargate" to view it µµµ. This discovery of some kind of a thermal grid in the "official" daytime IR images of Cydonia has obvious implications for the Enterprise Mission's claims that the leaked "real" image set is an honest IR representation of Cydonia, and that the "official" images represent an attempted cover-up. This is especially so as I believe that some of the grid features seen in both of the official daytime IR images of Cydonia that have been analysed in this article correspond with one another. However, as this enhancements section of the website is for the purpose of cataloguing and enhancing artificial looking anomalies in official data only, I will not comment in detail on the implications here. An evaluation of the authenticity of the "real" IR image can be found in a series of Cydonia Quest articles at the end of this link µµµ . These conclude that most of the grid patterns seen in the Enterprise Mission's ENVI processed images of the "real" IR bands began life as unusual rectangular noise patterns in the original raw data and do not represent something real. The Enterprise Mission position is that these unusual patterns in the original raw data are not "noise" but are the actual "signal" of something real. C µ Forward to Part 2 µ Forward to Part 3 µ Forward to Part 4 µ Return to the Enhancements page
|


